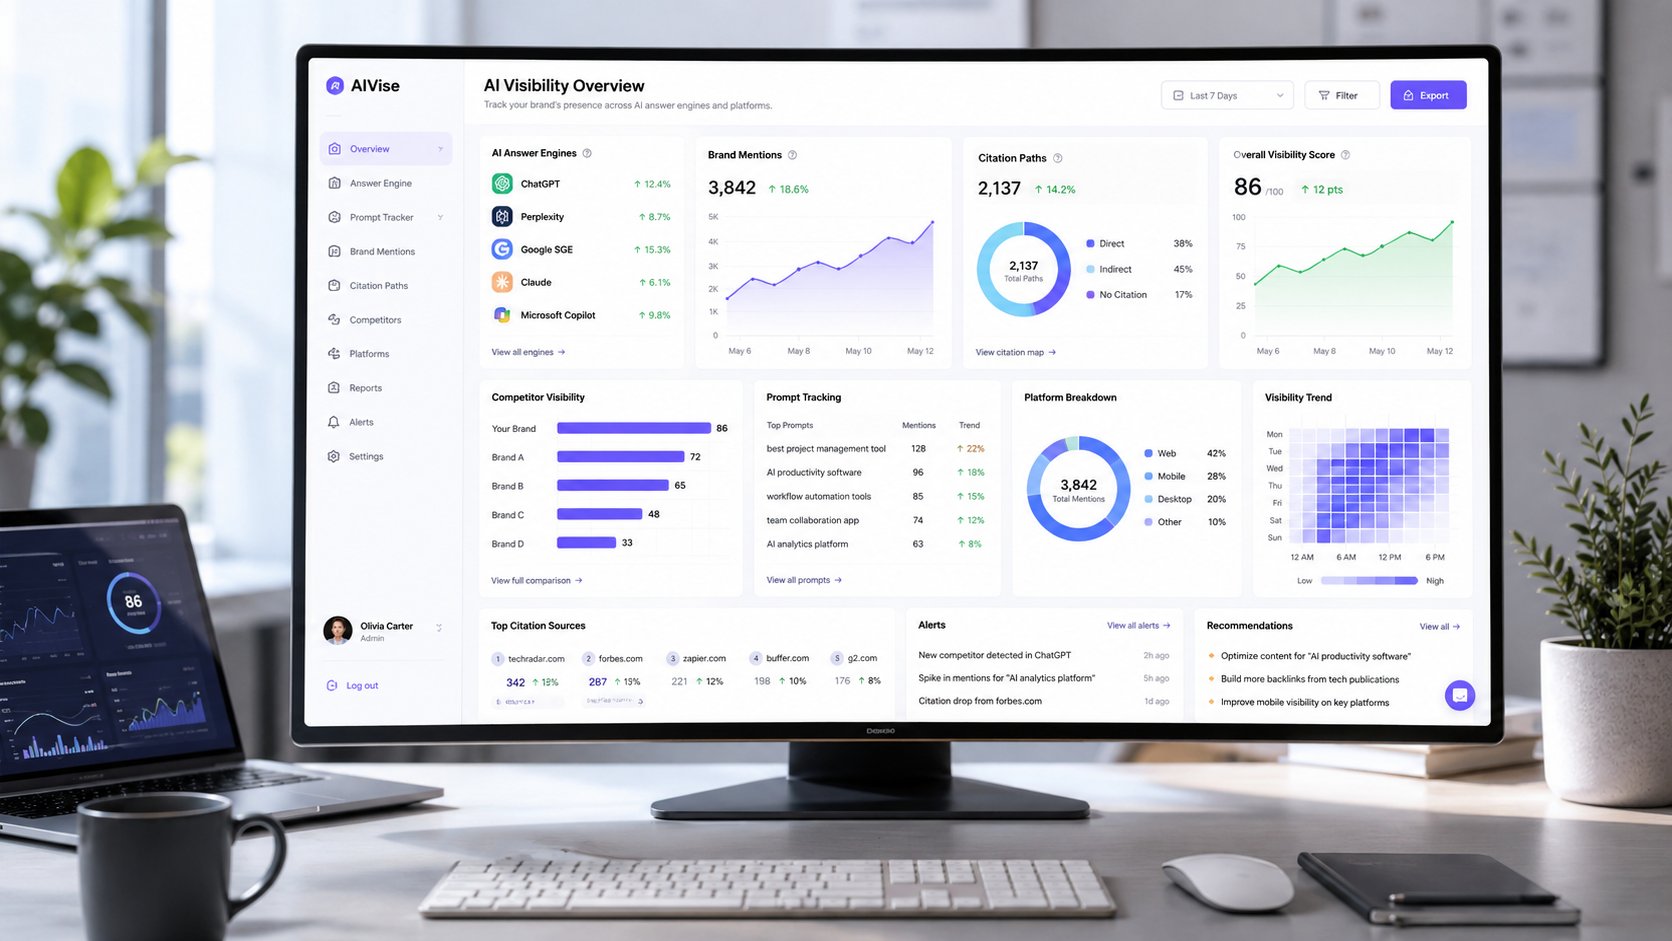

A competitor dashboard can look busy and still leave a growth team stuck. It may contain traffic estimates, feature comparisons, ranking charts, review counts, and a tidy list of rival campaigns. Then a leadership question arrives: Why is that brand winning, and what should we change next? The dashboard offers no defensible answer.
That gap defines the difference between competitor research and competitive benchmarking. Research collects facts about other companies. Benchmarking creates a repeatable measurement system that compares performance, identifies gaps, and connects those gaps to decisions. The same discipline becomes even more important in AI-mediated discovery, where the competitor that appears in an answer may be a publisher, review site, community, or alternative category rather than a direct rival.
The practical test is simple. If your benchmark can't tell you which prompt, source, process, or page deserves attention, it isn't finished. It's just a prettier spreadsheet.
The Moment a Competitor Dashboard Stops Working
A marketing team usually reaches the breaking point after a familiar reporting cycle. Someone adds a competitor to the tracker, imports estimated traffic, copies product features into a comparison sheet, and creates a line chart for share of voice. The numbers move, but the decisions don't. Nobody can explain whether the gap comes from stronger authority, broader content coverage, better distribution, or a measurement artifact.
The problem isn't a lack of data. It's that the team has treated competitive intelligence as a deliverable rather than as an operating discipline. A one-time snapshot can show what a competitor has published or how its offer is positioned. It can't show whether your gap is widening, which conditions produced it, or whether a change you made improved the result.
Practical rule: A benchmark earns its place when it changes a decision, not when it fills a dashboard.
A working benchmark starts with a defined question. You might ask why a rival earns more visibility for high-value product queries, whether your content is losing citations in a particular market, or whether a process is underperforming against comparable teams. The question determines the peer set, the metrics, the data sources, and the cadence.
AI answer engines make this harder. A brand can appear in one response and disappear from another because the prompt, model, market, language, or cited source changed. Tracking only a total visibility score hides the conditions that matter.
This article treats competitive benchmarking as a measurement practice. It covers the definition, the four common types, a repeatable process, AI-visibility complications, useful tooling, and the controls that turn findings into an actionable backlog.
What Competitive Benchmarking Actually Means
Competitive benchmarking is best understood as a fitness tracker for business performance. A single weigh-in tells you where you are today. A consistent record, using the same measurement conditions, shows whether you're improving and where the gap remains.
In practical terms, competitive benchmarking is a continuous, quantitative comparison of products, services, processes, or key performance indicators against direct competitors or recognised industry leaders. The purpose isn't to collect every available fact. It's to measure comparable performance over time and use the difference to decide what deserves improvement.
That separates benchmarking from adjacent practices:
Competitor research gathers information about products, pricing, messaging, content, and positioning.
Competitive intelligence interprets external signals to support strategic decisions.
Competitive benchmarking repeatedly measures defined outcomes against a deliberately selected peer set.
The distinction matters because inconsistent definitions destroy comparability. If one team's visibility rate counts any brand mention and another counts only cited recommendations, their charts may look precise while measuring different things.
The modern management practice is generally traced to Xerox in 1979, when the company compared copier products, manufacturing costs, features, and quality with Japanese competitors. Historical accounts describe competitors with substantially lower manufacturing costs, including some able to sell machines at prices close to Xerox's own production cost. By 1981, Xerox had adopted benchmarking across all business units. The practice then spread across industrial organisations and expanded from cost comparison into continuous quality improvement across sectors. The APQC overview of benchmarking types provides useful context for that development.

The lesson from Xerox isn't to copy a rival's tactics. It's to turn a subjective threat into a measurable gap, investigate the practices behind the gap, and act on what transfers to your situation. For AI visibility, that means fixing prompt definitions, competitor labels, markets, models, sampling conditions, and citation rules before interpreting the results.
The Four Types of Benchmarking and Which Ones Matter
The standard taxonomy is useful because different decisions require different comparison groups.
Competitive benchmarking compares your organisation with direct competitors. A SaaS company might compare product discoverability, conversion signals, or AI recommendations against companies serving similar buyers. This is the closest match to the question, “Where do we stand against the brands customers are likely to choose instead?”
Functional benchmarking compares the same business function across different industries. A software team studying the customer-support process of a well-run airline isn't copying the airline's product. It's examining a process that may reveal a better operating model.
Generic benchmarking looks for broadly transferable practices, such as quality control, onboarding, documentation, or feedback collection. It works when the underlying activity matters more than the category.
Internal benchmarking compares departments, regions, products, or teams within the same organisation. It's often easier to control because the data definitions and systems are more accessible. It can reveal a strong internal process before the company searches externally for inspiration.
For digital growth, competitive and functional benchmarking usually carry the most immediate weight. Competitive comparisons reveal where your brand loses visibility to named rivals. Functional comparisons can reveal how a publisher, community, or adjacent category earns citations for the same customer question.
A useful benchmark compares the conditions behind performance, not just the performance label.
AI-mediated discovery makes a single leaderboard especially unreliable. The relevant competitor may change with the prompt. The model may draw from different sources. A brand can lead on traditional search rankings while losing generated recommendations, or appear frequently while receiving citations from sources with little commercial relevance.
A durable AI-visibility benchmark therefore tracks comparable prompts, models, markets, mention rates, share of voice, and citation patterns longitudinally. It doesn't treat each generated answer as a verdict. It treats every response as one observation in a controlled measurement system.

Running a Benchmark Step by Step
Start with the decision, not the dashboard. “Improve visibility” is too broad to guide measurement. “Increase our presence for high-intent comparison prompts in a defined market” gives the team something it can operationalise.
Define the comparison
Choose a peer set that shares meaningful conditions with your business. Consider business model, geography, customer segment, price tier, channel mix, and the actual alternatives buyers consider. A global enterprise and a small regional provider may sit in the same category but still be poor comparators.
Next, define every metric before collecting data. Write down the numerator, denominator, time window, population, currency, and source. For AI visibility, distinguish a brand being mentioned from a brand being recommended, and distinguish both from being cited as the source of an answer.
Build the measurement layer
A focused scorecard is more useful than an encyclopaedia of metrics. The table below maps common choices to the decisions they can support.
Metric area | Decision it supports | Typical data source | Watch out for |
|---|---|---|---|
Mention rate | Whether the brand is present for target prompts | Archived model responses | A mention may not indicate preference |
Share of voice | How often the brand appears relative to the peer set | Prompt-level response collection | Aggregate scores can hide prompt losses |
Citation frequency | Whether owned or earned sources support the answer | Citation and source archives | Frequent citations may come from weak domains |
Prompt coverage | Which customer questions the benchmark actually represents | Query research and prompt libraries | Prompt-set drift breaks trend comparisons |
Source-domain diversity | Whether visibility depends on a narrow source base | Cited URLs and referring domains | More domains aren't automatically more relevant |
Business outcome | Whether visibility connects to qualified demand | Analytics, CRM, conversion records | Correlation doesn't prove incrementality |
Collect evidence from multiple layers. Public disclosures and industry documentation provide context. Third-party trackers can provide directional signals. Your own operational records show what happened inside the business. Where definitions don't support a fair comparison, report the evidence qualitatively rather than forcing it into a precise ranking. Guidance on competitive intelligence platforms is useful when deciding how to organise these inputs.
Normalisation prevents false conclusions. Adjust for seasonality, currency, market mix, and changes in model or platform behaviour where the data allows it. Report a peer median to describe the typical position and a top-quartile ambition to define a credible improvement level. One market leader is a weak benchmark because its advantage may come from scale, history, or exposure you can't reproduce.
Decompose the gap
A lower visibility rate can result from fewer relevant pages, weaker source authority, insufficient prompt coverage, or model-specific variation. Those causes require different actions. Creating more content won't fix a citation problem caused by weak sources, and outreach won't solve a prompt library that omits important customer language.
Why AI Visibility Changes the Rules
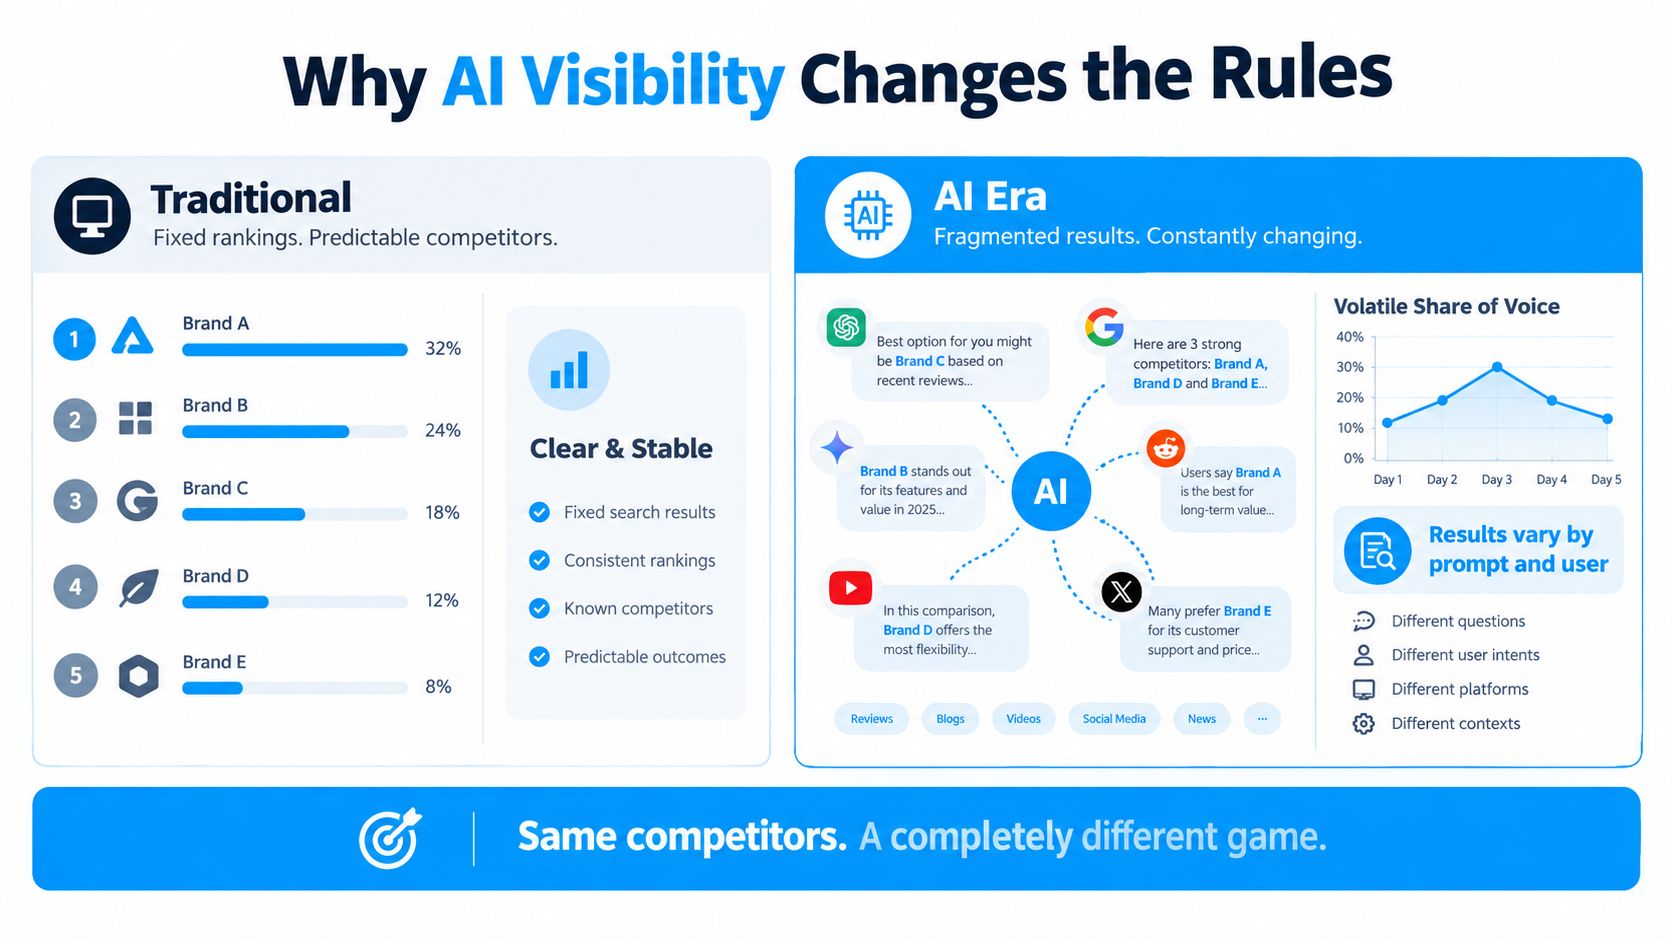
Traditional competitive benchmarking assumes a reasonably stable market map. AI answer engines don't offer that comfort. The result can depend on the prompt, model, market, language, device, and citation source, so the relevant competitive set may change from one question to the next.
A direct rival may dominate a product comparison prompt. A specialist publisher may dominate an educational question. A community may appear for practical troubleshooting. An alternative product category may enter when the user describes a need rather than a solution. Treating all of those responses as one company-versus-company contest produces a misleading average.
The first correction is to split visibility into separate dimensions:
Mention rate, whether the brand appears at all.
Share of recommendations, whether the model actively presents it as an option.
Citation frequency, whether the brand's pages or associated sources support the answer.
Business impact, whether qualified demand, engagement, or conversion follows.
These measures answer different questions. A brand can be mentioned often without being recommended. It can be recommended without owning the cited source. It can receive citations without generating measurable commercial value.
The traffic evidence reinforces the distinction. A study of nearly 70,000 Google searches from about 900 US users found traditional-result clicks on roughly 15% of searches without AI Overviews, compared with about 8% when an Overview appeared. Cited links inside Overviews received clicks in only about 1% of visits, according to the reported Google AI Overviews findings. Visibility inside an answer is therefore not interchangeable with a visit, and a visit isn't the same as revenue.
Quality matters as much as frequency
A single aggregate score rewards brands that appear frequently, even when their citations come from weak or commercially irrelevant sources. Prompt-level reporting exposes that problem. It shows which questions produce losses, which competitors appear instead, and which domains shape the answer.
The measurement also needs variance. Compare models separately, preserve the original responses, and label the retrieval conditions. A search-grounded answer engine may reflect current retrieval behaviour, while a non-browsing model may reflect learned associations. Combining them into one number without context hides the reason for the result.
For teams working on AI visibility optimisation, the practical implication is clear: benchmark the answer environment, not just the brand list. The winning action may be a content update, a new explanatory page, stronger third-party references, or a revised prompt set.
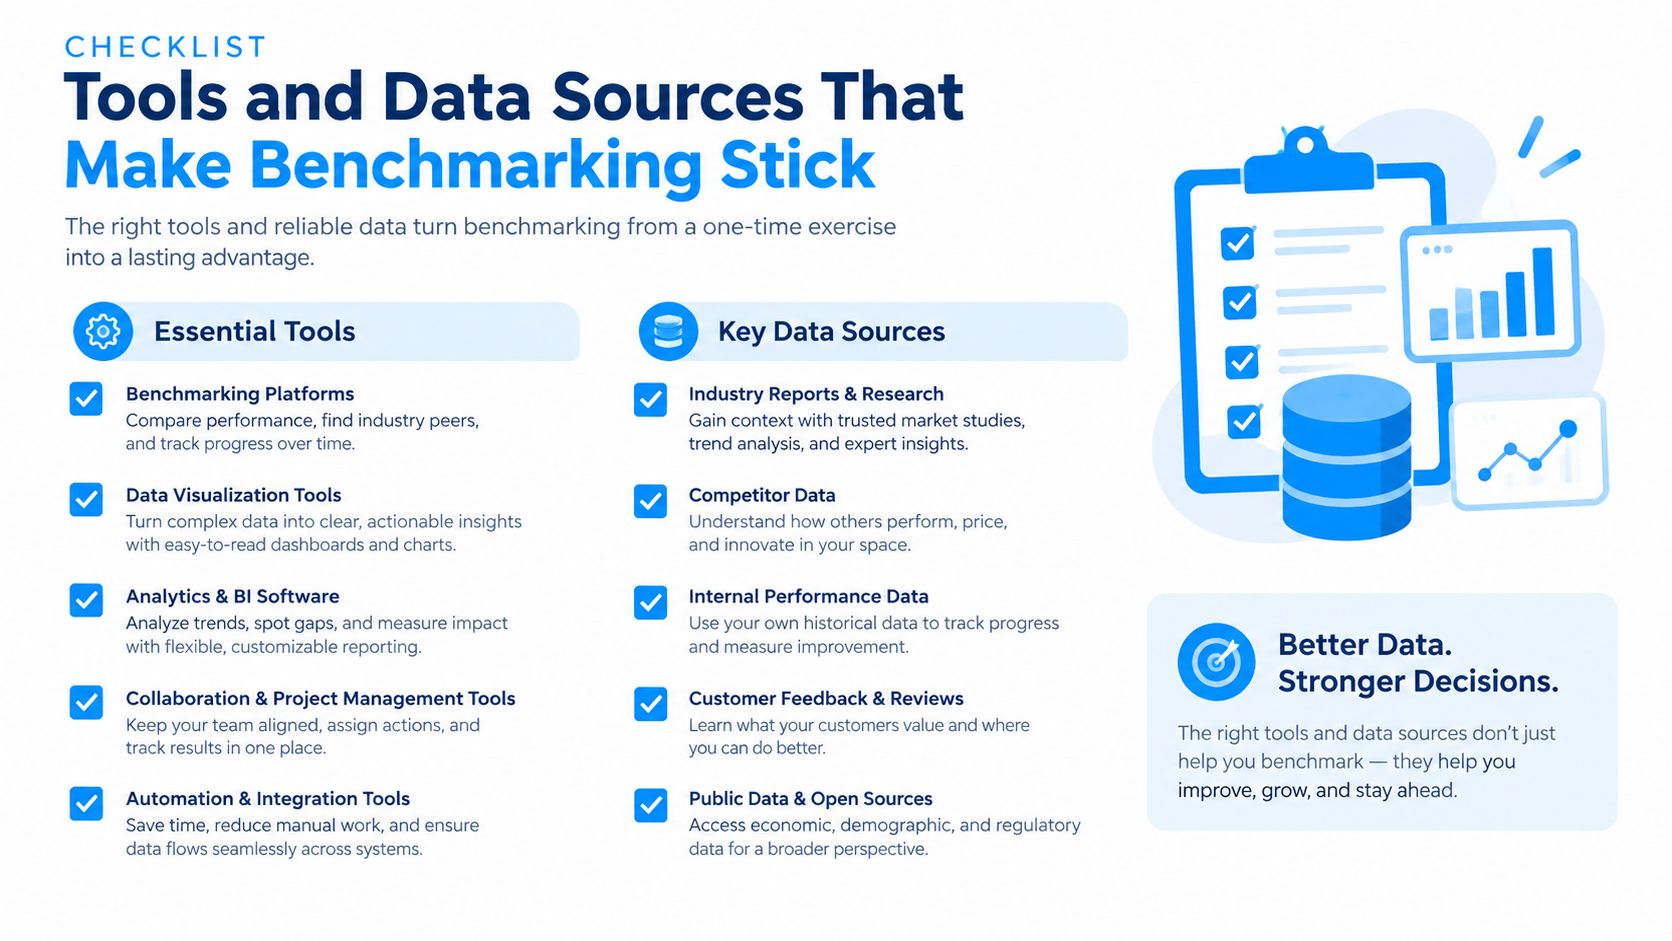
Tools and Data Sources That Make Benchmarking Stick
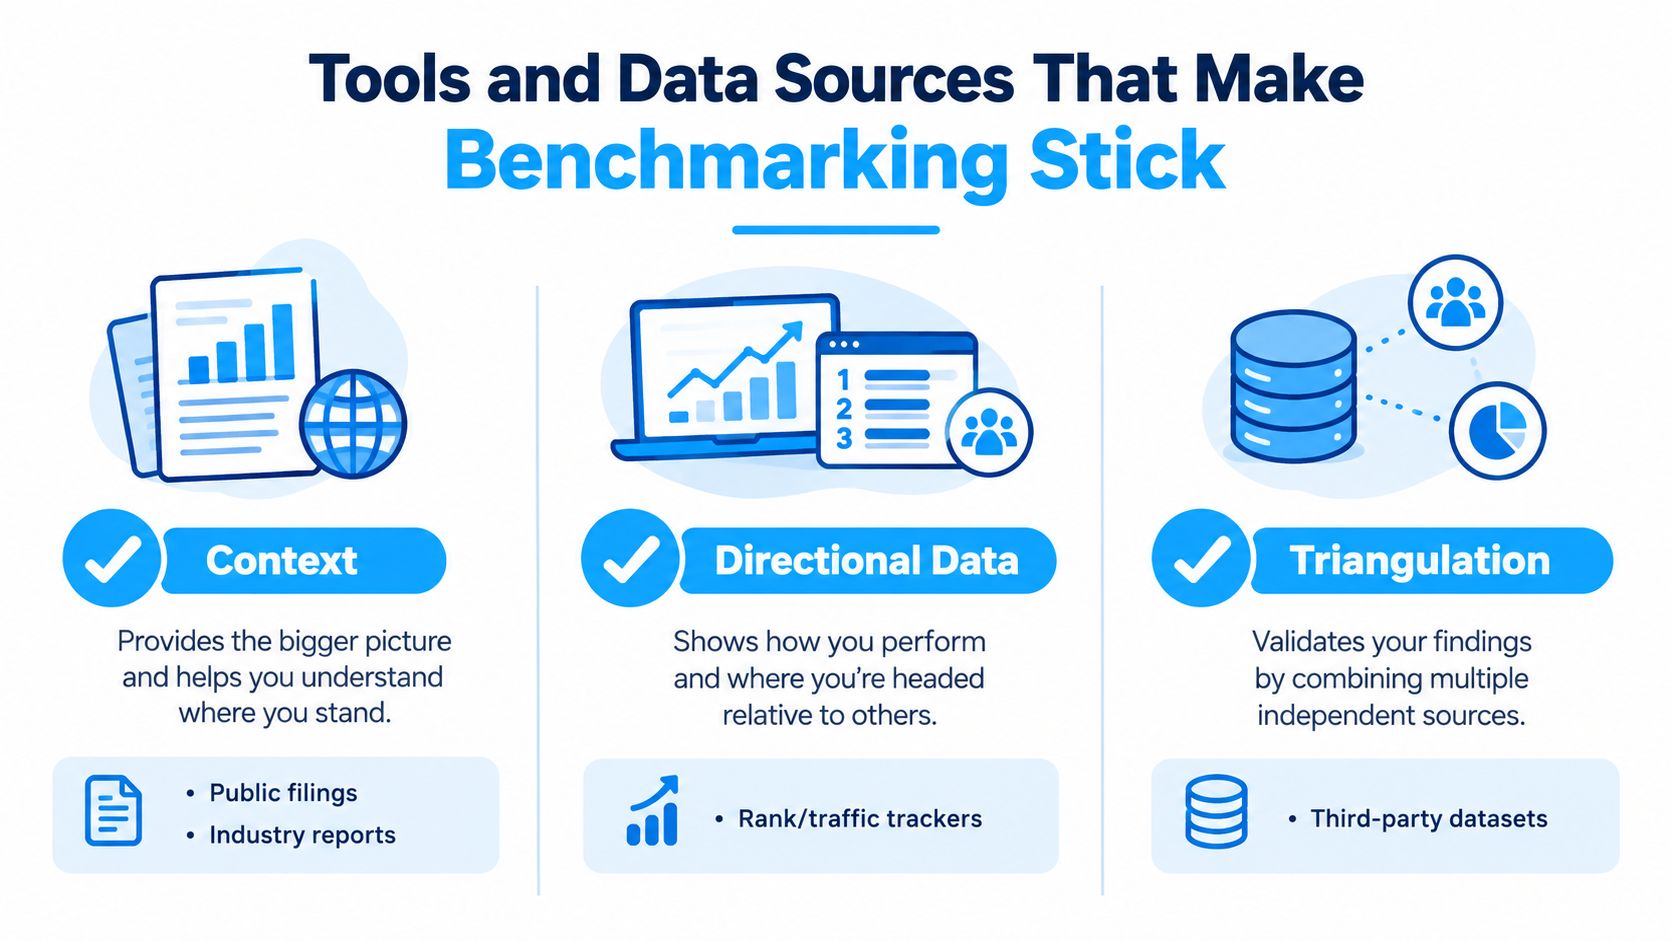
No single tool can explain competitive performance. The useful setup has layers, and each layer answers a different question.
Public filings and industry reports provide context about positioning, markets, product changes, and stated priorities. They rarely give a complete performance picture, but they help explain why a competitor may have different exposure or resources.
Rank and traffic trackers offer directional data for traditional search. They can help identify overlapping topics, ranking movement, estimated traffic patterns, and share-of-search changes. They can't reliably reveal the full reasoning or source selection inside generated answers, so they shouldn't be treated as AI-visibility measurement systems.
Third-party datasets and customer signals support triangulation. Reviews, industry documentation, analyst coverage, structured interviews, and operational records can confirm or challenge a claim. Data quality improves when teams compare independent signals instead of relying on a single promotional statement.
Purpose-built AI-visibility platforms measure the answer layer directly. A useful system should support prompt archives, competitor labels, model coverage, citation sources, response history, and trend analysis. It should preserve the conditions behind each observation so a team can distinguish a real shift from a changed prompt or model version.
Llumo is one option in this category. It measures per-prompt visibility, share of voice, competitor trends, and citation sources across AI surfaces including ChatGPT, Gemini, Perplexity, Copilot, and Google AI Overviews. It also supports response archives, query fan-out logging, citation analysis, and opportunity prioritisation. Teams can connect their own provider API keys and pay underlying provider costs directly, which changes the cost model compared with bundled usage plans.
A traditional rank tracker is still valuable for traditional search. An AI-visibility platform fills a different gap. It can show which prompts produce a mention, which source domains get cited, whether a citation is new or lost, and how the competitive picture changes across models.
The selection criterion shouldn't be the number of charts. Ask whether the system lets you inspect raw responses, freeze prompt definitions, compare the same competitor set, and connect a gap to a page or outreach task. For link-focused work, competitor link analysis can add useful context, but it still needs to sit inside a broader benchmark rather than stand in for one.
Turning Benchmark Findings Into Action
A benchmark fails when the report becomes the final product. The useful output is a prioritised set of decisions, each tied to a measurable gap and a plausible driver.
Start by ranking opportunities by expected impact and effort. A prompt cluster where your brand is absent, a competitor is consistently recommended, and the cited sources are clearly addressable may deserve attention before a broad campaign to improve every topic. A narrow citation gap can be more actionable than a large but unexplained visibility difference.
Use trends, not isolated snapshots. Repeat observations under the same conditions, keep control prompts that shouldn't change, and label model versions and retrieval settings. Generative responses vary, so the result should include sample size and uncertainty information where the measurement design supports it. A benchmark that cannot show its sampling conditions can't tell you whether movement reflects content work or noise.
Test the causal story
A visibility increase is not automatically an incremental business gain. Research covering more than 3,000 queries from June 2024 to September 2025 reported that pages cited in AI Overviews had 35% higher organic click-through rates and 91% higher paid click-through rates, while the researchers cautioned that the relationship may not be causal. The Seer Interactive analysis is a useful reminder to treat association as a hypothesis, not proof.
To test the business effect, connect benchmark changes to qualified visits, assisted conversions, pipeline, or another outcome that matters to the decision. Use control prompts or comparable markets when possible. If the business outcome doesn't move, investigate whether the problem lies in attribution, audience quality, citation relevance, or the assumption that visibility should have produced demand.
Keep the system honest
Review the benchmark specification regularly, but don't change it casually. Watch for prompt-set drift, altered competitor labels, inconsistent markets, model-version changes, and shifts in sampling cadence. Decompose every important movement into pages, authority, prompt coverage, source quality, and model behaviour before assigning work.
The final question isn't “Who ranks first?” It's “What decision does this gap justify?”
That question keeps benchmarking connected to execution. Teams should update content, strengthen relevant sources, revise coverage, or stop an ineffective initiative based on what the evidence supports. The dashboard is only the measurement surface. The value appears when someone changes the plan.
Llumo measures how brands are mentioned and cited across AI answer engines, with per-prompt visibility, share of voice, competitor trends, citation analysis, and archived responses. Visit Llumo to see how a repeatable AI-visibility benchmark can turn generated-answer data into concrete content and growth decisions.