

Share of voice is the percentage of all attention or mentions in your market that belong to your brand compared with everyone else. In paid advertising, 10 points of excess share of voice has been associated with about 0.5 points of market-share growth, making SOV a useful directional measure, not a sales guarantee.
You can feel the problem before you can see it in a dashboard. Two brands launch similar campaigns, target the same audience, and publish comparable content. One starts appearing in more conversations, search results, and AI-generated answers. The other keeps reporting healthy activity but gradually becomes harder for buyers to find. The difference is often not campaign quality alone. It's who owns the larger share of attention across the discovery journey.
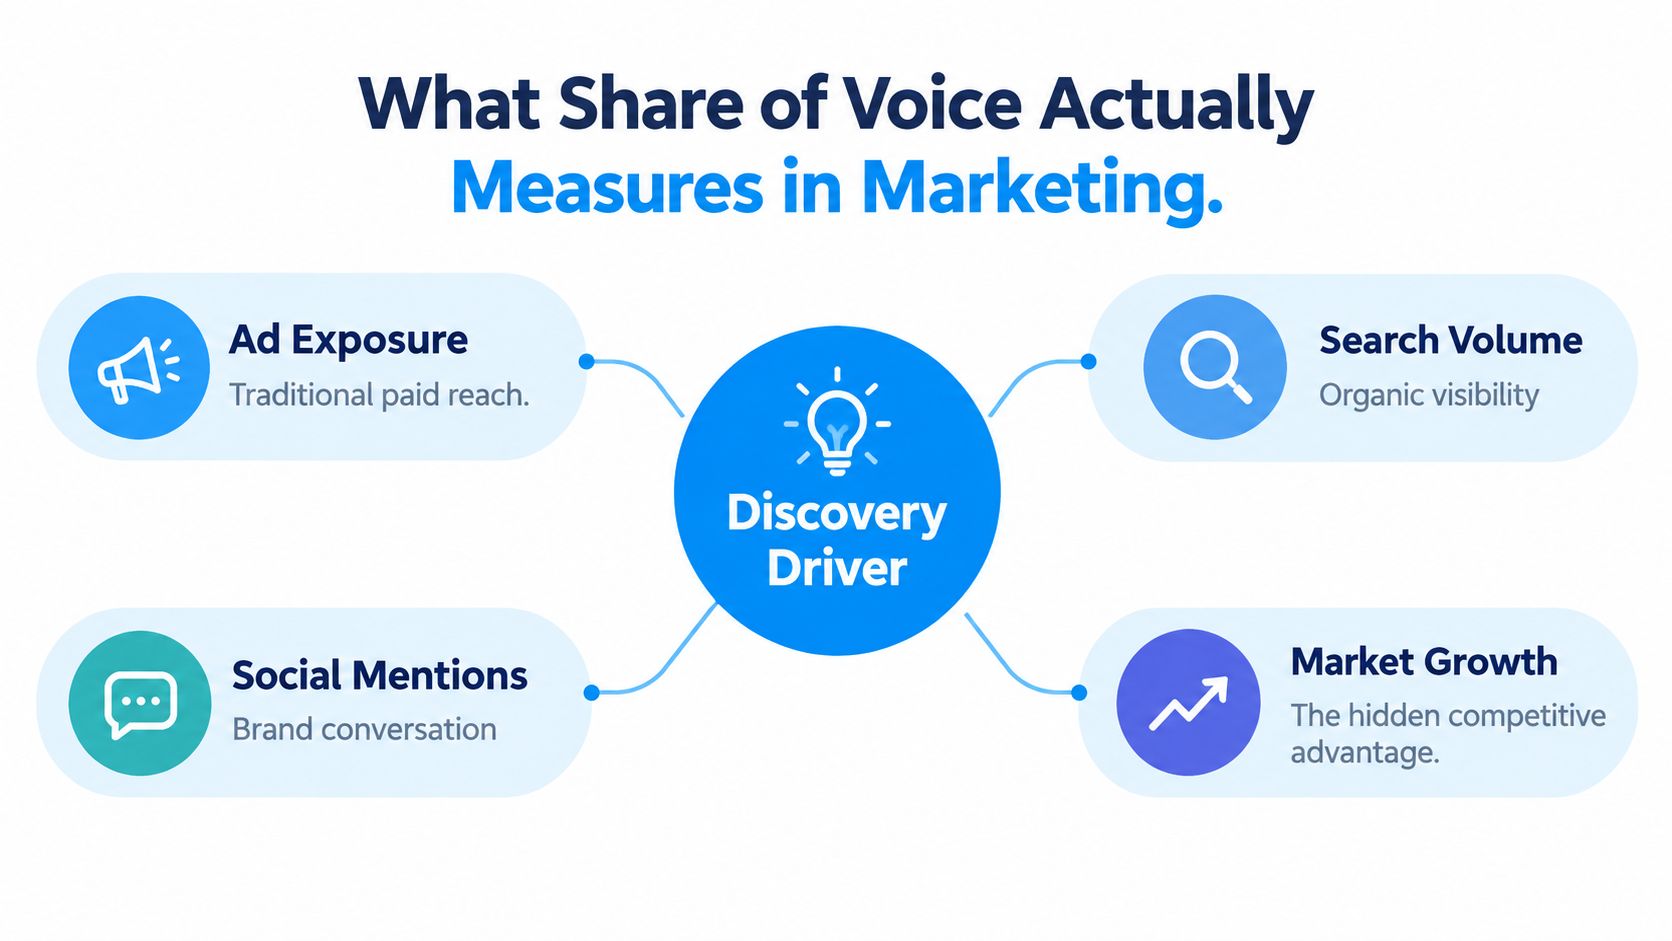
What Share of Voice Actually Measures in Marketing
Two otherwise similar brands can create near-identical campaigns and still grow at different speeds. One may receive more ad exposure, earn more editorial mentions, rank for more valuable searches, or appear in the sources that AI answer engines use to construct recommendations. Those signals compound because buyers encounter the brand more often and in more contexts.
That's the practical meaning of share of voice in marketing. It measures your brand's visibility against a defined market or competitor set. The original advertising use compared a brand's media spending with total category spending across a market, channel, and time period, as described in Nielsen's history of share of voice. It was never intended to be a direct sales measure.
Visibility is the signal, market share is the outcome
SOV becomes strategically useful when you compare it with share of market. A brand with 20% of category sales but only 12% of category visibility may be underinvesting relative to its current position. A smaller brand with 12% of sales and 20% of visibility has excess SOV, meaning it is claiming more attention than its present market share would suggest.
That relationship matters because visibility often moves before commercial outcomes. John Philip Jones's work and later analyses of excess share of voice helped connect investment share with future market-share movement. A Nielsen analysis of 123 brands found that every 10 points of excess share of voice corresponded to about 0.5 points of market-share growth, although the relationship should be treated as a benchmark rather than a promise.
SOV also changes depending on the signal you measure:
Ad spend or impressions show paid presence.
Social and media mentions show conversation and earned attention.
Organic visibility shows how much search opportunity your brand captures.
AI citations and mentions show whether answer engines include your brand in research and recommendations.
Practical rule: SOV is strongest as a competitive-detection tool. It tells you where attention is being won or lost, then gives you a starting point for deciding what to change.
The Share of Voice Formula and What the Numbers Mean
The core calculation is straightforward:
Share of voice = your brand metric ÷ total market metric × 100
The formula stays consistent, while the numerator and denominator change by channel. If your brand earns 80 relevant mentions and the defined market earns 400, your SOV is 20%. If your ads generate 30,000 eligible impressions in a market with 100,000 available impressions, your impression-based SOV is 30%.
The result is useful only when the denominator remains stable. Brandwatch's SOV glossary applies the same structure to brand mentions, ad impressions, social visibility, and search traffic. Before calculating, define the competitors, geography, audience, topic, platform, and measurement window.
Read the movement, not just the percentage
A single SOV percentage gives leadership limited context. Compare it with market share, pipeline, branded demand, qualified traffic, or another revenue proxy. The strategic question is whether excess SOV is translating into market-share movement.
Use the pattern to guide the decision:
SOV below market share: Increase visibility where current demand and commercial performance justify defending or expanding attention.
SOV close to market share: Maintain coverage unless growth targets require additional pressure.
SOV above market share: Check whether the excess reaches relevant buyers and supports conversion before increasing investment.
SOV falling while competitors rise: Protect the discovery areas that influence evaluation, even if absolute traffic or mentions remain healthy.
When budgets tighten, this creates a practical decision matrix. High excess SOV with no market-share movement points to improving relevance, conversion, or measurement before adding spend. Low SOV with strong commercial momentum supports focused investment in the channels where competitors are gaining. Stable SOV and stable market share usually call for maintenance rather than broad expansion.
Paid advertising uses its own vocabulary. In search advertising, impression share shows how often ads appeared compared with available opportunities. For organic search, Search Engine Land's guide to SOV defines SEO SOV around estimated organic traffic for a selected keyword set divided by the total possible organic traffic for that set.
Keep Citation SOV separate from paid, organic, social, and media measures. It tracks how often AI answer engines cite or mention a brand in relevant answers, creating a distinct visibility layer rather than another form of search traffic.
The difference between raw visibility and useful visibility remains important. Weight analysis toward the topics, queries, audiences, sources, and AI answers that influence commercial evaluation.
How to Measure Share of Voice Across Key Marketing Channels
Start with one market definition and keep it fixed. Choose the competitors buyers compare, select a consistent time window, and decide whether the decision calls for spend, impressions, mentions, or traffic. Mixing these metrics in one denominator creates a score that looks precise but answers no clear question.
Paid media and advertising
For paid media, use media spend or impressions within the same category, market, channel, and period. The structure is:
Paid SOV = your spend or impressions ÷ total category spend or impressions × 100
Pull spend from your media platforms or finance data. Pull impression share from advertising platforms when the question is how much eligible inventory you captured. Don't compare your branded campaign impressions with a competitor's full-category presence. The two numbers describe different markets.
Social and earned conversation
For social SOV, collect relevant brand mentions, not only posts published by your own accounts. Define whether you're measuring every mention, a topic-specific conversation, or a weighted set of outlets and audiences. Social listening platforms can help remove duplicates, classify sentiment, and identify competitor mentions.
For media SOV, use monitored publications and count comparable mentions. A prominent feature and a passing reference aren't equivalent, so you may apply a transparent weighting system. Keep the rule unchanged across competitors and periods.
Organic search visibility
Build a keyword set around category, problem, comparison, and use-case searches. Track each competitor's ranking presence and assign visibility based on the organic opportunity available for those terms. Search Engine Land's explanation of SEO SOV is useful here because it distinguishes estimated organic traffic potential from a simple count of ranking pages.
A practical workflow looks like this:
Define the market: Fix competitors, topics, location, device, and search intent.
Collect the numerator: Export impressions, mentions, spend, or estimated organic opportunity.
Build the denominator: Add the same metric for every included competitor.
Normalize the period: Compare equivalent windows and account for seasonality.
Connect the result: Relate SOV movement to qualified visits, branded demand, leads, or pipeline.
Channel | Typical metric | Common data source |
|---|---|---|
Paid advertising | Spend or impression share | Ad platform reports and finance data |
Social | Relevant brand mentions | Social listening platform |
PR and media | Weighted media mentions | Media monitoring platform |
Organic search | Estimated traffic opportunity | Rank tracking and search data |
AI answers | Mentions and citations by prompt | Answer-engine monitoring system |
A platform such as Llumo's guide to AI visibility trackers can sit alongside traditional search and media tools when you need to monitor answer-engine visibility separately. The key is not the tool alone. It's preserving the same competitor set and measurement logic over time.
Applying Share of Voice in AI Answer Engines and AEO
A brand can gain conventional search visibility while becoming less present in the answers buyers receive from AI systems. Traditional SOV relies on a defined inventory, such as ad impressions, social mentions, or a keyword set. AI answer engines use a less stable process shaped by the prompt, model, conversation context, hidden query expansions, and selected sources.
That requires a separate measurement layer: Citation SOV. It tracks the share of monitored prompts, answers, mentions, or citations associated with your brand within a defined competitor set. Mention and citation are different signals. A brand may appear in the answer without supplying a cited source, while another brand may receive little visible mention but appear repeatedly in the references. Record both.

Normalize prompts before comparing models
Build a prompt set around buyer questions at different stages:
Category discovery, such as “What types of tools solve this problem?”
Vendor evaluation, such as “Which platforms should a team compare?”
Use-case research, such as “What works for a distributed marketing team?”
Objection handling, such as “What are the drawbacks of this approach?”
Run equivalent prompt families across ChatGPT, Gemini, Perplexity, Copilot, Claude, and Google AI Overviews where access allows. Store the exact prompt, model, date, location, brand and competitor mentions, cited domains, cited pages, and answer framing.
The guide to answer engine optimisation explains why keyword rankings alone do not capture this activity. One prompt may lead an AI system to several related searches before it assembles a response from changing sources. Preserve those expansions in your tracker, rather than treating the original wording as the complete query.
Use separate scores for each visibility type:
Prompt mention share: Brand mentions divided by all competitor mentions for the prompt set.
Citation share: Brand citations divided by all tracked competitor citations.
Weighted answer share: A score assigning greater weight to prominent recommendations and relevant buying prompts.
Source ownership: The proportion of cited pages or domains associated with your brand.
Report these layers separately. Combine them only when the weighting reflects a specific business decision, such as increasing qualified demand or protecting visibility in a priority category.
The strategic question is whether excess SOV is producing market-share movement. Classic SEO SOV may rise while Citation SOV remains flat or declines. That gap indicates a loss at the answer-engine moment, when a buyer receives a shortlist, explanation, or recommendation without visiting several pages. Track both measures before deciding whether to invest in conventional search coverage, answer-ready content, or stronger source visibility.
Turning Share of Voice Findings Into Clear Actions
A dashboard doesn't improve SOV. A decision does. When budgets tighten, rank opportunities by commercial relevance, expected SOV movement, evidence of demand, and cost to win.
Start by separating three situations:
Finding | Likely decision |
|---|---|
Low SOV on high-value category prompts | Fund content, technical improvements, or paid coverage |
Strong search SOV but weak Citation SOV | Improve source quality, topical depth, digital PR, and answer-ready content |
High SOV but weak commercial response | Audit message fit, landing pages, product positioning, and conversion quality |
Falling SOV across several channels | Protect core visibility before expanding into new topics |
Prioritize the cheapest meaningful gain
If one channel can produce a 5-point SOV gain with less effort than another, start there, provided the channel reaches the right buyers. That might mean recovering lost paid impression share, updating pages that already rank near valuable results, earning citations from sources answer engines already use, or turning existing research into media assets.
Don't chase a percentage in isolation. A gain in an irrelevant conversation is less valuable than a smaller gain in a decision-making topic. Your opportunity score should include the prompt or keyword's commercial role, competitor strength, current visibility, content gap, and execution cost.
Budget test: Fund the channel where a meaningful SOV gain is both affordable and connected to a revenue proxy.
Make the report credible to leadership
Use a fixed competitor set, stable measurement windows, and an explanation of every methodology change. Show SOV alongside qualified organic visits, branded search activity, sales inquiries, pipeline contribution, or another metric leaders already trust.
Track the trend monthly if your market changes quickly, but don't react to every fluctuation. Look for persistent movement, then investigate which competitors, topics, pages, campaigns, or citation sources caused it. A competitive intelligence platform such as Llumo's competitive intelligence overview can support this kind of monitoring, especially when the analysis spans multiple brands and discovery surfaces.
Common Share of Voice Mistakes and How to Avoid Them
The most dangerous SOV error is assuming that more organic visibility always means more opportunity. Search behavior is changing as answer engines summarize information directly, and independent research cited by Brand24's share-of-voice guide reports zero-click rates above 35% for informational queries before AI Overviews. The same source reports that AI Overviews appeared on 13.14% of all queries by March 2025, up 102% from January, with a higher share reported for informational queries. These figures describe a changing search environment, not a universal result for every site or query set.
Where SOV reporting goes wrong
Competitor drift: Adding a new rival halfway through a reporting period can create a false decline or increase.
Denominator changes: Comparing total-market mentions in one period with direct-competitor mentions in another makes the percentages incompatible.
Mixed numerators: Spend, impressions, mentions, and traffic represent different kinds of visibility. Don't add them together without a defined weighting model.
Single-channel fixation: Strong social visibility can coexist with weak search presence, media coverage, or AI citation share.
Prompt instability: AI answers vary by model, wording, location, date, and conversation history. Store the exact prompt and response context.
Vanity targets: A rising SOV score doesn't prove that the audience is relevant, the message is trusted, or the product converts.
Before approving investment, check five things: Is the market defined? Is the competitor set stable? Is the denominator consistent? Is the visibility commercially relevant? Is there a revenue proxy to monitor? If the answer to any of these is no, fix the measurement before interpreting the trend.
SOV works best as a leading indicator. It helps you notice competitive pressure early, but it can't replace product quality, positioning, customer experience, or sales execution. The useful question isn't “What is our SOV?” It's “Which share of attention are we earning, from whom, on which discovery surface, and what happens after the buyer sees us?”
Llumo helps teams measure AI answer-engine visibility through per-prompt brand mentions, citations, competitor share of voice, query fan-out, and source trends across major models and search surfaces. If you want to connect Citation SOV with practical content and digital-PR opportunities, visit Llumo and explore how to build a repeatable AI visibility measurement process.