
The top 1% of cited domains capture 47% of all AI search citations, while the next 9% capture another 31%. In AI answer engines, share of voice is the percentage of tracked prompts where your brand is mentioned or cited, and it behaves like a power-law market where a small number of sources dominate.
That changes how an AEO statistics report should be built. A brand can collect mentions without earning authority, appear in one model while disappearing from another, or gain citations that point to the wrong page. A useful report therefore measures where your brand appears, how it's represented, which sources are selected, and whether those gains persist across ChatGPT, Perplexity, Gemini, and other answer surfaces.
What an AEO Statistics Report Actually Is
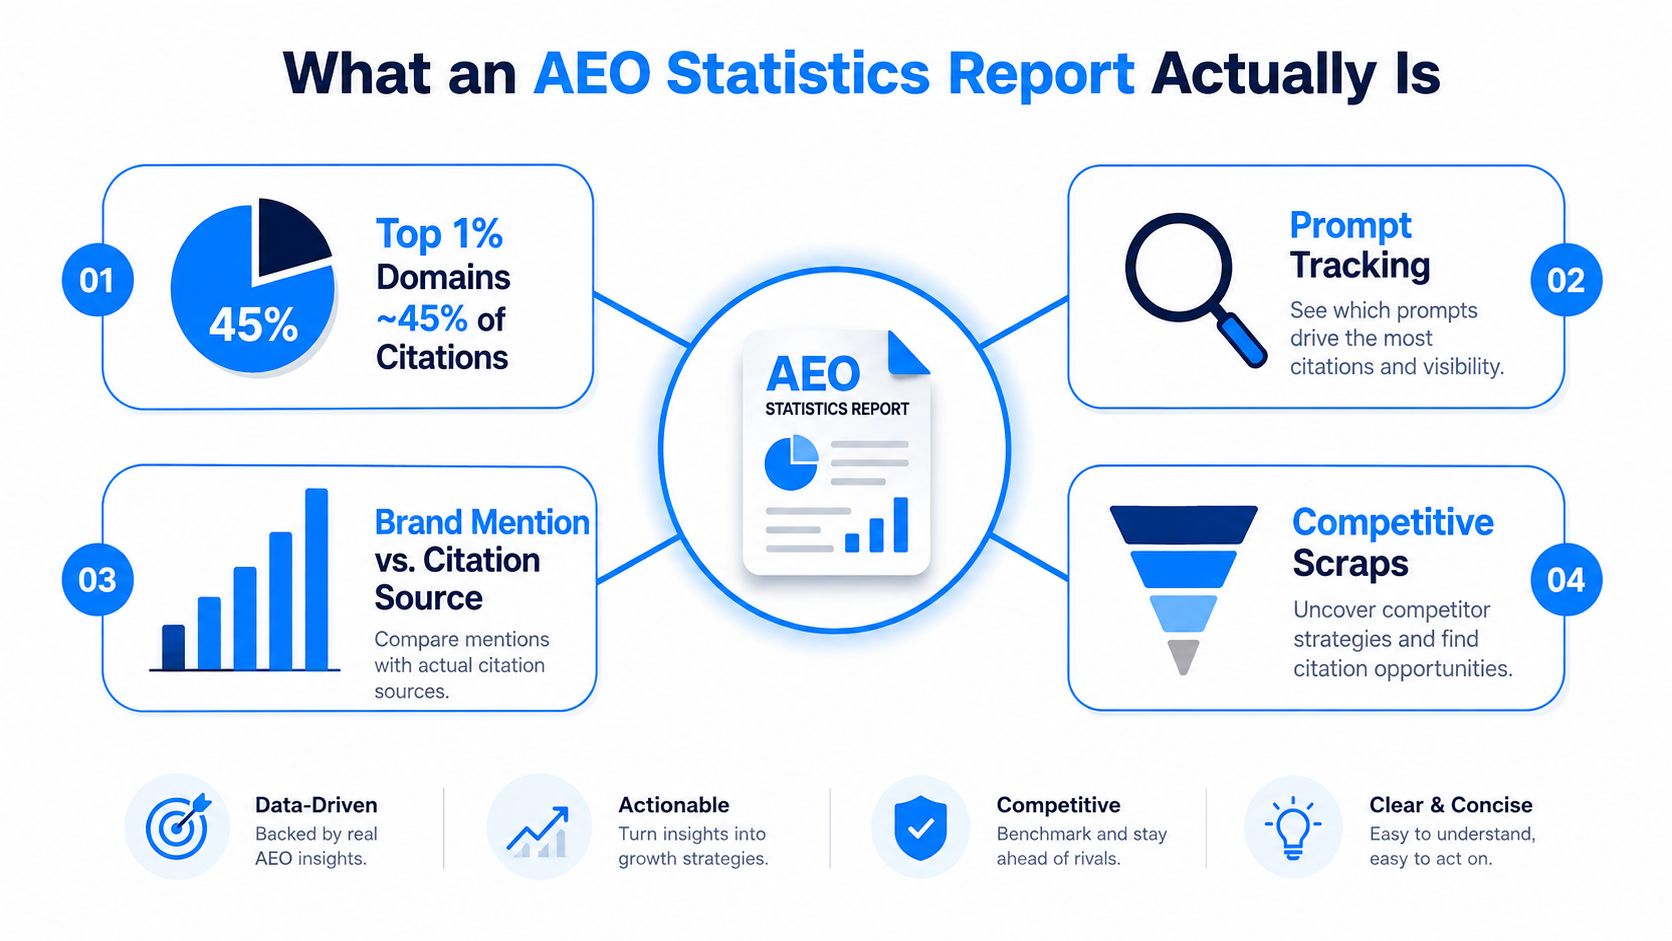
Most brands enter an AEO report expecting a ranking table. They should expect a market concentration map instead. The AI citation distribution study found that the top 1% of cited domains captured 47% of all citations, the next 9% captured 31%, and the remaining domains shared 22%. That means many brands are competing for the long tail before anyone reviews a dashboard.
An AEO statistics report is a recurring measurement artifact that inventories the prompts you track, the answers engines generate, the brands mentioned, the URLs cited, the source domains selected, and the changes between collection periods. A serious report also separates visibility from authority. A brand mention shows that an engine included the brand in its answer. A citation shows that the engine used a source associated with the brand. Those outcomes can move in opposite directions.
The report is not an SEO report with new labels
SEO reporting usually organizes performance around keywords, rankings, landing pages, backlinks, and organic clicks. AEO reporting uses a different object of measurement:
Prompt intent: The tracked input might ask for a vendor recommendation, a category comparison, a definition, or a product shortlist. The prompt captures the user's task, not only a keyword variation.
Answer surface: The relevant result is the generated response, including its wording, recommendations, caveats, and citations.
Citation lineage: The report traces the answer back to the cited URL and domain, rather than treating every reference as an equivalent backlink.
Model volatility: The report compares responses over repeated runs because source selection can change even when the prompt stays constant.
Citation reliability makes this distinction necessary. A 2023 evaluation of four generative search systems found that only 51.5% of generated sentences were fully supported by their citations, while 74.5% of citations supported the sentences they accompanied. The same evaluation found average support rates ranging from 18.9% for YouChat to 70.9% for Bing Chat, with Perplexity at 70.6% and NeevaAI at 69.8%. A mention or citation isn't automatically an accurate representation.
Build a defensible first version
Before instrumenting anything, define four inputs:
Prompt universe: Group prompts by intent, market, audience, product category, and buying stage. A small, stable prompt set is more useful than an enormous unstructured export.
Engine coverage: Record which models and surfaces you're testing. ChatGPT, Perplexity, and Gemini may produce similar answers while selecting different evidence.
Citation parser rules: Decide how you'll handle linked URLs, source cards, duplicate domains, redirecting pages, and citations that don't support the statement beside them.
Competitor cohort: Select named competitors that appear in the same buying conversations. Don't compare your brand with every company in the category.
A report can then include prompt-level presence, mention rate, citation rate, source-domain share, cited-page changes, sentiment, competitor comparisons, and archived responses. Llumo's AEO services are one way to operationalize this kind of recurring tracking across prompts, citations, competitors, and reporting.
The common misuse is treating one weekly SOV percentage as the KPI. That number is only a slice of a skewed distribution. The useful question is whether your brand is gaining presence in high-intent prompts, valuable engines, and citation clusters where competitors already control the answer shelf.
Share of Voice in AI Answer Engines Explained
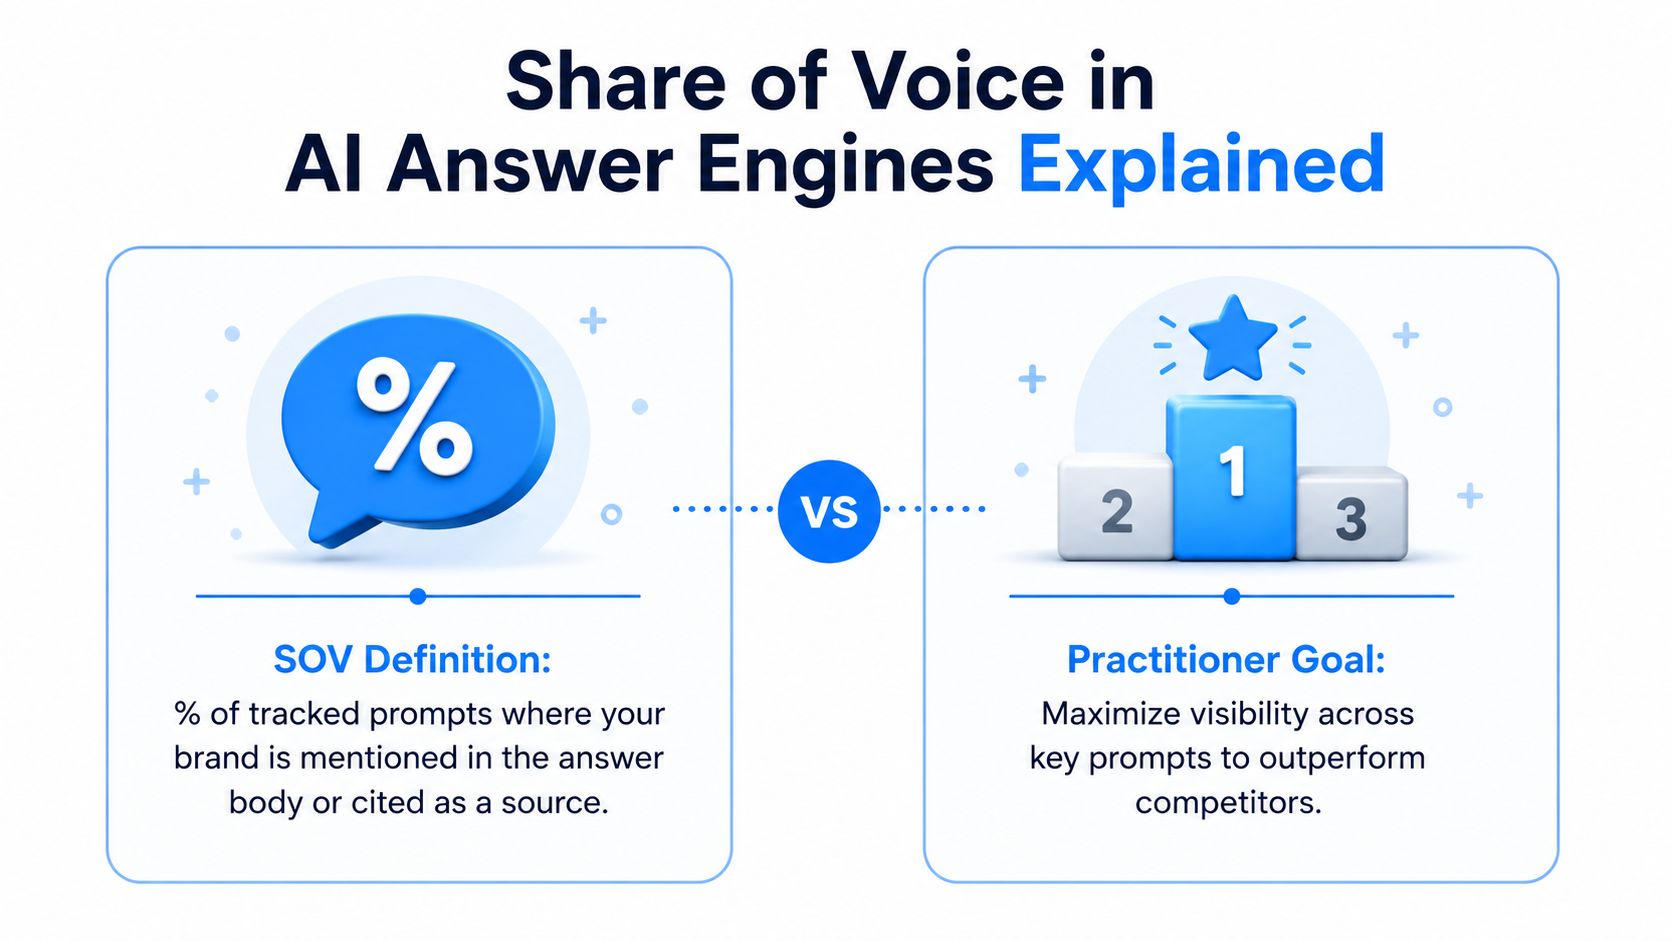
A brand can dominate mentions yet lose the evidence layer. AI answer-engine share of voice is the percentage of tracked prompts where your brand appears in the answer or is cited as a source, measured across a defined prompt universe and engine set. Treat it as a distribution of answer positions, not a single visibility score.
An answer works like shelf space. If an engine recommends five products and names your brand once, that is one form of presence. If it cites your research as evidence, your brand holds a more authoritative position. A report that counts both appearances identically hides that difference.
Two measurement families answer different questions
Brand mention SOV measures whether the model names your brand. Detection is relatively straightforward: search answer text for the brand, common variants, and product names. The signal is broad and useful for awareness and recommendation tracking, but it can include weak, qualified, or negative mentions.
Citation SOV measures whether the model uses a page or domain associated with your brand as evidence. It is narrower and more useful for authority analysis, while also being harder to parse consistently. An engine may cite a page that does not support the nearby claim, use a redirected URL, or show a source label without enough detail to validate the underlying page.
The Tow Center study of 1,600 tests across eight AI search engines found that systems failed to retrieve the correct article information more than 60% of the time. Citation volume therefore needs a quality check. Preserve the original response, validate the cited URL, and assess whether the page supports the statement it follows.
Mentions and citations often diverge at the prompt level. A model may recommend a brand from general knowledge without a current citation. It may also cite a brand's guide without naming that brand prominently in the response. Keep both fields instead of compressing them into one blended score.
Choose the denominator before calculating
Teams generally use three denominators:
Tracked prompts: The percentage of prompts in which your brand appears. This is the clearest denominator for prompt-level visibility.
Tracked answers: The percentage of generated answers containing your brand. Use this when one prompt runs across multiple engines or repeats over time.
Tracked citations: Your brand's share of all citations collected for the prompt set. This measures source competition, not simple brand presence.
Each denominator supports a different decision. Prompt SOV works for client-facing visibility reporting. Answer SOV helps compare engine runs. Citation SOV shows whether your brand is earning evidence-level presence in a concentrated source market, where a small group of domains can capture a disproportionate share of citations.
Practical rule: Keep the numerator and denominator at the same level. Do not divide brand mentions in prompts by citations across answers and label the result share of voice.
Preserve engine-level values as well. A blended score can conceal strong mention visibility in ChatGPT alongside weak citation presence in Perplexity. That split points to different work, such as improving answer framing in one engine and building third-party source support in another.
How to Calculate Share of Voice With Real Numbers
Start with a fixed example. Suppose you track 200 prompts across ChatGPT and Perplexity. Your brand appears in the answer to 46 prompts, is cited in 28 answers, and the collection contains 612 total citations.
These numbers support three useful calculations, but they don't mean the same thing.
Use prompt-based SOV for broad visibility
The first formula is:
Prompt-based SOV = prompts with a brand mention ÷ total tracked prompts
In the example:
46 ÷ 200 = 23%
Your brand mention SOV is therefore 23%. This tells you that the brand appeared in nearly a quarter of the tracked prompt set. It doesn't tell you whether the mentions were positive, prominent, accurate, or supported by a citation.
Use answer-based SOV for presence across generated responses
The second formula is:
Answer-based SOV = prompts where the brand appears in any answer ÷ total tracked prompts
If the same 46 prompts contain the brand in an answer, the result remains:
46 ÷ 200 = 23%
This formula becomes more useful when you run each prompt repeatedly or across several engines. The denominator can then be the total number of tracked answers, while the numerator counts answers containing the brand. Document that change clearly, because prompt-level and answer-level SOV aren't interchangeable.
Use citation-based SOV for source competition
The third formula is:
Citation-based SOV = brand citations ÷ total citations
In the example:
28 ÷ 612 = 4.58%
Rounded for reporting, the brand's citation share is 4.6%. That's dramatically lower than its mention SOV, and that difference is informative. The brand is entering answers more often than it's being selected as evidence.
Formula | Calculation | Result |
|---|---|---|
Prompt-based SOV | 46 mentioned prompts ÷ 200 tracked prompts | 23% |
Answer-based SOV | 46 answers with brand ÷ 200 tracked prompts | 23% |
Citation-based SOV | 28 brand citations ÷ 612 total citations | 4.6% |
Protect the denominator
Three reporting errors inflate SOV:
Mixed engine volumes: One engine may produce more citations per answer than another. Report engine-level results before blending them.
No-citation prompts: An answer with no citations shouldn't be treated as evidence that every brand has zero citation share.
Name collisions: A common brand or product name may match an unrelated company. Use domain validation, entity context, and known product terms.
For citation share, exclude prompts that return zero citations for all brands before dividing. Otherwise, the denominator includes opportunities where no source was selected, which can distort the comparison.
The two figures I watch most closely are prompt coverage and citation share. Prompt coverage tells you whether the measurement universe represents real customer questions. Citation share tells you whether your brand is winning source selection inside that universe. A single blended SOV can't replace either one.
For teams choosing instrumentation, a comparison of AEO tracking tools should focus on response archives, URL validation, prompt-level exports, engine normalization, and lost-citation reporting, not just dashboard appearance.
Why AI Visibility Behaves Like a Power-Law Market
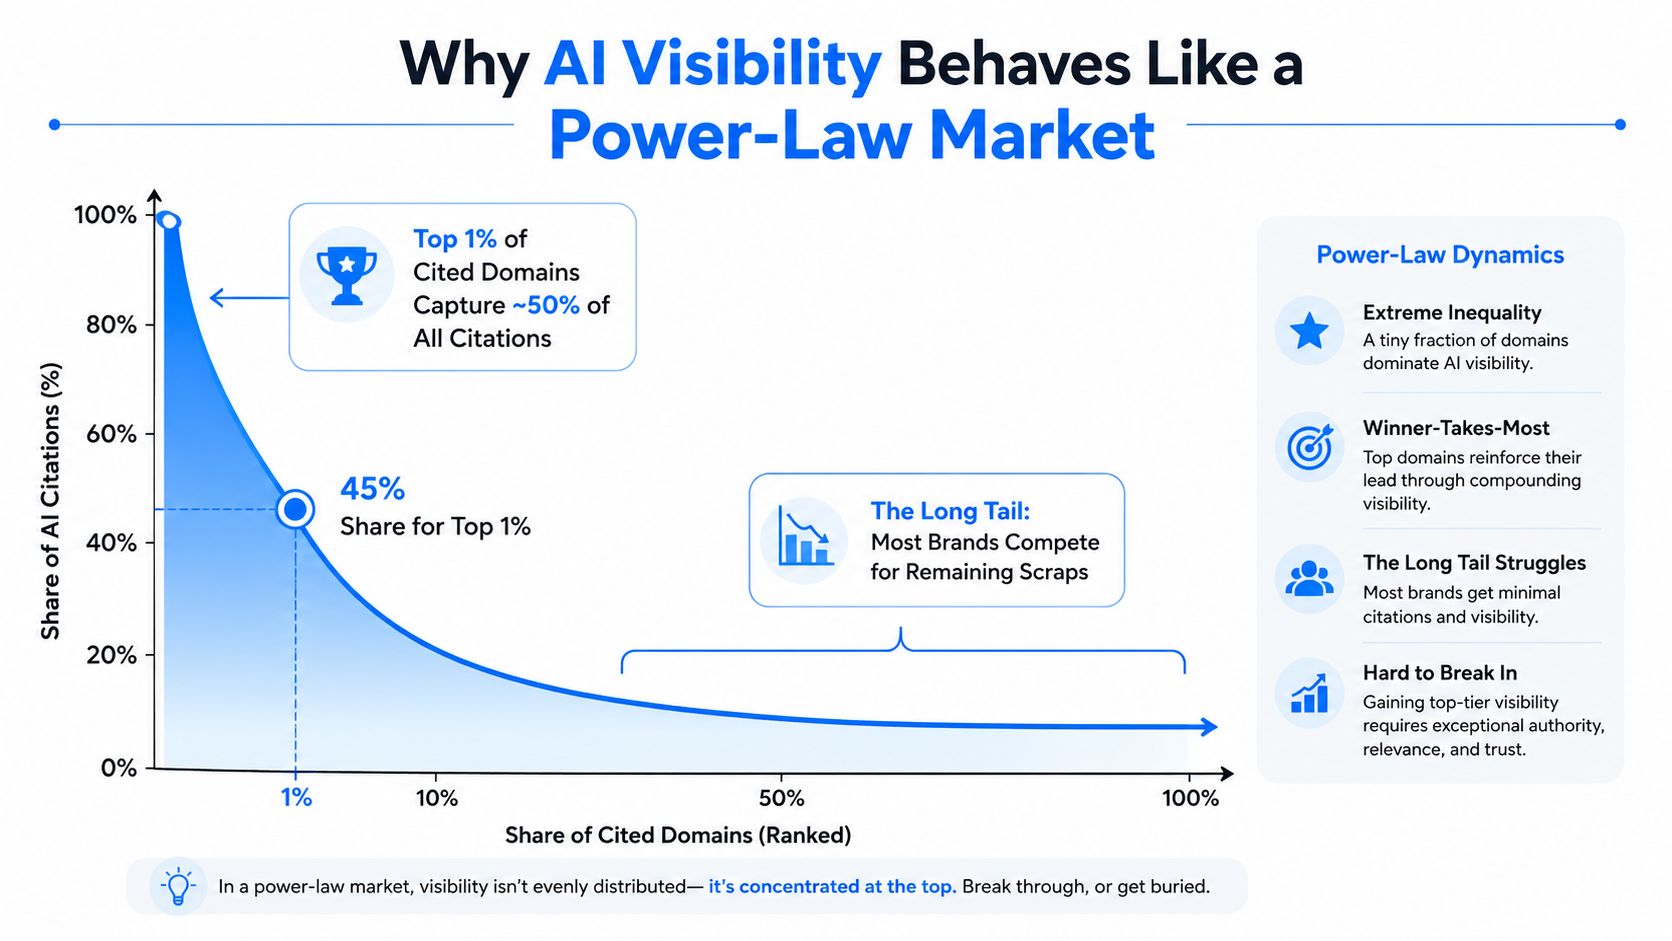
AI answer engines don't distribute citations evenly across the web. The citation concentration analysis found that the top 1% of cited domains captured 47% of citations, while the next 9% captured 31%. The remaining 90% of domains shared 22%.
That shape resembles a power-law market. A small head receives disproportionate attention, and a long tail competes for the remainder. This isn't just a marketing preference. Retrieval systems often select sources that already offer recognizable entities, structured information, broad topical coverage, or repeated evidence of usefulness.
Why the head gets stronger
High-intent comparison prompts tend to narrow the available source set. A user asking for project management software, accounting platforms, or enterprise security tools usually receives a shortlist rather than an exhaustive directory. Engines favor pages that compare multiple options, summarize market categories, or provide recognizable evidence.
The same pattern appears in concentrated domain selection. A large analysis of 36 million AI Overviews and 46 million citations found that Wikipedia, YouTube, Google properties, Reddit, and Amazon together accounted for 38% of citations (Digital Bloom's analysis). Those domains cover different intents, but each has strong discoverability and a large body of potentially retrievable material.
The practical consequence is uncomfortable. Publishing another general category page may add content without changing your position in the citation head. You need to identify the specific prompt clusters where authoritative sources dominate, then decide whether your brand can become relevant to that source set.
Allocate effort by citation density
A team that spreads equal effort across every prompt wastes resources. Weight prompts by:
Commercial importance: Does the prompt influence vendor selection or only general education?
Competitive concentration: Do a few domains appear repeatedly in answers?
Current brand gap: Is your brand absent, mentioned without evidence, or cited inaccurately?
Source accessibility: Can you improve your own page, earn a third-party mention, or publish evidence that fits the query?
The long tail is not automatically an opportunity. A low-competition prompt with no commercial value can consume the same reporting and production effort as a category-defining query.
The curve also creates a timing advantage for incumbents. A domain that already appears in influential comparison pages, reference databases, community discussions, and editorial coverage has more chances to be retrieved. New entrants should prioritize a narrow group of valuable prompt clusters rather than attempting broad coverage immediately.
The chart below illustrates why a raw citation count can mislead. Ten new citations from low-density prompts may matter less than one durable presence in a cluster where buyers repeatedly ask for recommendations.
Benchmarking Against Competitors Across AI Engines
Cross-engine benchmarking fails when teams treat ChatGPT, Perplexity, and Gemini as interchangeable answer generators. They're not. They use different retrieval paths, expose different citation interfaces, and may select different sources for answers that sound almost identical.
Perplexity's source selection provides a clear example. A study covering 6,020 domains and 17,540 citation events found that Perplexity heavily favored structured market databases such as G2, Grand View Research, Crunchbase, Fortune Business Insights, and MarketsandMarkets, while underweighting analyst research firms and wire services (Perplexity source-selection research). A brand that performs well in one engine can therefore lack the source profile another engine prefers.
Build the benchmark before collecting data
Choose a competitor cohort of 5 to 8 named brands. Include the companies buyers compare, not every adjacent provider. Then create a fixed prompt library of 50 to 100 queries spanning category education, problem discovery, comparison, alternatives, implementation, pricing, and recommendations.
Run the same prompt library across all three engines on a consistent schedule. Store:
Per-prompt presence: Which brands were named, recommended, criticized, or omitted?
Citation identity: Which URLs and domains supported the response?
Engine-level SOV: What share did each brand hold within ChatGPT, Perplexity, and Gemini?
Citation overlap: Which sources appeared for multiple competitors?
Mention-to-citation gap: Which brands were named often but rarely used as evidence?
Normalize scores on a per-engine basis. Perplexity's citation-heavy output shouldn't automatically outweigh a mention-led ChatGPT response. The goal is to compare competitive position within each engine first, then use a clearly labeled blended view for directional analysis.
Read the dashboard as a split, not an average
Consider a hypothetical project-management category. Competitor A may own Perplexity citations because structured software databases mention it repeatedly. Competitor B may dominate ChatGPT mentions because its brand is familiar in general recommendations. Competitor C may appear less often but earn citations from authoritative product documentation.
A dashboard that reports only one blended SOV hides those differences. A useful table would look like this:
Competitor | ChatGPT SOV | Perplexity SOV | Gemini SOV | Blended SOV |
|---|---|---|---|---|
Competitor A | Track separately | Track separately | Track separately | Weighted result |
Competitor B | Track separately | Track separately | Track separately | Weighted result |
Competitor C | Track separately | Track separately | Track separately | Weighted result |
The table intentionally keeps the measurement logic visible. Don't fill it with invented values or present a blended number without showing the engine components. A blended score is only useful when the prompt weights, engine weights, and collection rules are documented.
The AI visibility tracker for agencies fits this reporting model by organizing multi-brand, multi-prompt visibility and competitive trends. Whether you use that platform, a spreadsheet, or an internal pipeline, preserve the response archive. Without the original answer, you can't tell whether a competitor gained a citation, your brand lost a mention, or the engine changed its wording.
How Durable Are Your AEO Wins Really
High SOV is not automatically a moat. Citation patterns can shift quickly when engines refresh retrieval indexes, change source selection, or generate a different answer path for the same prompt. A benchmark tracking 1,127 URLs across ChatGPT, Perplexity, Gemini, Copilot, and Google AI Overviews measured citation behavior across multiple collection waves. Another report found that AI Overview citations from top-10 organic results fell from 76% in July 2025 to 38% by January 2026, as noted earlier in the AI Visibility Gap Study.
That evidence changes what counts as an AEO win. A citation recorded once is a snapshot. A citation that survives repeated collection waves, appears across multiple engines, and points to a page that continues to support the answer is closer to a durable asset.
Measure decay instead of celebrating peaks
Every AEO statistics report should include a durability layer:
Rolling 14-day decay: Shows whether a recent gain holds through short-term retrieval changes.
Rolling 30-day decay: Separates persistent visibility from a temporary spike.
Lost-citation alerts: Flags prompts where a competitor replaced your URL or domain.
Prompt-level drift detection: Identifies queries where the cited source set changed while intent stayed constant.
Freshness pressure: Flags pages that may need review because their information, examples, or product details no longer match the answer environment.
Label each citation as durable or fragile. Durable citations recur across collection waves or multiple engines. Fragile citations appear once, depend on a single model, or point to a page with weak topical alignment.
Don't confuse different kinds of visibility
Citations, brand mentions, and recommendations measure different outcomes. A brand can retain recommendation visibility while losing its source citation, or gain citations without becoming a preferred recommendation. Treating these signals as one score makes it harder to identify the work that will improve competitive position.
If a citation isn't defended weekly, it isn't an asset. It's a snapshot.
Respond to volatility by checking the affected prompt before changing content. Determine whether the shift involves a high-intent query, a valuable competitor comparison, or a low-priority informational search. Then inspect the replacement source and the exact answer language. The appropriate response may be a content refresh, a digital PR effort, a clearer product page, or no action.
Durability reporting turns a temporary peak into a testable trend. It also shows whether a citation is becoming part of the brand's repeatable presence in AI answer engines or merely benefiting from one retrieval event.
Turning Your Report Into a Decision Document
A report becomes useful when every metric points to an owner and a next action. The dashboard should answer four questions: What changed, why did it change, what should we do, and by when?
Start with prompt-level evidence rather than a top-line score. A drop in overall SOV may come from one engine, one intent group, or a small number of high-volume prompts. The action depends on the pattern.
Use four decision branches
Low SOV on high-intent prompts usually calls for content and authority work. Review the answer language, identify which competitors appear, inspect the cited URLs, and update pages that fail to answer the comparison or recommendation directly. On-page improvements help when your own page is relevant but unclear. They won't solve a missing third-party authority signal by themselves.
A competitor citation surge points toward source-seeding and digital PR. Find the new or newly selected domains, classify them as editorial, community, database, research, or brand-owned sources, and decide which relationships or evidence could make your brand more citation-eligible. Don't copy the competitor's wording. Understand the source path that made the competitor available to the engine.
Prompt coverage gaps require taxonomy expansion. If your library covers product comparisons but ignores implementation, alternatives, integrations, or role-specific problems, the SOV trend may look stable while important demand remains unmeasured. Add adjacent prompts, tag them by intent, and establish a baseline before judging movement.
Citation decay triggers a re-optimization sprint inside the selected decay window. Validate the lost URL, compare the replacement source, check content freshness and factual support, and record the intervention. A change without a before-and-after archive is difficult to interpret.
Set a cadence people can maintain
Use a weekly check-in for prompt-level drift and lost citations. Keep the meeting narrow: review material changes, assign owners, and record whether each issue needs content, PR, product clarification, or observation.
Run a monthly SOV review against the fixed competitor set. Separate engine results, intent groups, mentions, citations, and source-domain changes. Use the monthly meeting for resource allocation rather than rewriting the measurement model.
Recalibrate the prompt taxonomy quarterly. Customer language changes, products launch, competitors reposition, and answer engines expose new query patterns. A prompt set that never changes eventually measures the history of your strategy rather than the market.
Force each metric into an operating plan
Metric | Trigger Condition | Recommended Action | Cadence |
|---|---|---|---|
Prompt coverage | Important intent groups are missing | Add and tag adjacent prompts, then establish a baseline | Quarterly |
Mention SOV | Brand presence falls on priority prompts | Review answer framing, category relevance, and competitor language | Weekly review, monthly decision |
Citation SOV | Competitors gain source share | Inspect replacement domains and launch targeted authority or PR work | Weekly |
Citation accuracy | A cited page doesn't support the answer | Validate the URL, correct the content, and monitor the prompt | As detected |
Citation decay | Previously repeated citations disappear | Run a refresh or source-development sprint | Within the chosen decay window |
Engine gap | Performance differs sharply by model | Adapt source and content tactics to the affected engine | Monthly |
Prompt drift | Cited source sets rotate for stable intent | Recheck the prompt, archive responses, and assess whether action is justified | Weekly |
A one-page decision document should include the metric, the affected prompt cluster, evidence from the archived response, the responsible owner, the recommended action, the deadline, and the next validation date. That format stops the AEO statistics report from becoming a read-only artifact.
The strongest reports don't promise permanent visibility. They create a repeatable operating loop: measure the answer, validate the source, identify the competitive change, assign the work, and test whether the citation survives.
Llumo measures per-prompt visibility, share of voice, mentions, citation sources, competitor trends, and response archives across AI answer engines. Visit Llumo to evaluate an AEO reporting workflow built around the signals that move competitive decisions.